

Ecommerce analytics helps an operator choose the right source for each business question and turn sales, customer, product, and marketing data into an informed next action. It connects a decision to the data needed to make it: increase spend, investigate checkout friction, reorder a product, or improve the experience after a first purchase.
For a DTC operator, budget decisions often get stuck between competing narratives. Store records show actual bankable cash and order outcomes, while ad platforms claim overlapping credit for the same buyers. Reconciling those numbers in manual spreadsheets week after week drains hours without clarifying whether to scale, hold, or cut spend. The goal is not a dashboard where every platform matches, but knowing: What changed, which evidence matters, and what should we do next?

1. Start with the decision and the period
Ecommerce analytics is the process of analyzing store and shopping data to support business decisions. Begin with one question, not a list of every available KPI.
- Profitable growth: Are more orders producing more contribution profit?
- Acquisition: Is higher spend bringing enough new customers?
- Conversion: Where does the measured purchase path weaken?
- Products: Which items deserve inventory or merchandising attention?
- Customers: Are first-time buyers returning within a comparable period?
Before reallocating marketing spend, follow a disciplined decision workflow:
- Select a commercial source of truth: Anchor commercial outcomes in verified store and financial order data, not platform estimates.
- Align definitions and windows: Ensure every channel is evaluated using comparable conversion windows, time zones, and order inclusion criteria.
- Separate blended metrics from attribution: Review store-wide efficiency (MER, contribution profit) separately from individual channel conversion credit.
- Check tracking and attribution limitations: Account for consent gaps, cookie loss, and self-attributing platform overlap before making a budget call.
Assign source-of-truth boundaries
No single tool is automatically the source of truth for every question. Give each source a defined job:
- Store, order, or financial records: orders, discounts, refunds, net sales, products, and customer purchase history.
- Advertising platforms: spend, impressions, clicks, and conversions attributed under each platform’s own measurement method.
- Behavior analytics such as GA4: measured sessions, events, and site paths, within the implementation’s event and consent coverage.
- Reconciled business reporting: store revenue and total included marketing spend for blended efficiency.
- Inventory and operations systems: available stock, replenishment, and fulfillment constraints.
Keep a short measurement specification: metric formula, source, date range, time zone, included order statuses, refund treatment, attribution window where relevant, and refresh timing. For refunds, specify whether they appear on the refund date or are allocated back to the original order period.
A metric is useful when it changes a decision—not merely because it appears on a dashboard.
2. Use a concise store metric map
Pair revenue with orders and average order value. Revenue alone cannot explain whether growth came from more orders, larger baskets, price changes, or a different product mix.
| Metric | Definition for the selected period | Decision it supports |
|---|---|---|
| Net sales | Gross merchandise sales minus discounts and returns under the chosen reporting policy; record tax and shipping separately. | Is commercial revenue growing? |
| Orders and units | Count eligible orders and item quantities separately, with canceled and test orders handled consistently. | Did order volume or basket composition change? |
| AOV | Selected revenue ÷ eligible orders from the same period. Label the revenue basis and refund treatment. | Did revenue per order change? |
| Session conversion rate | Sessions with a completed purchase ÷ eligible sessions × 100, in the same period and analytics implementation. | Did a smaller share of measured visits convert? |
| Gross margin | (Net sales − cost of goods sold) ÷ net sales × 100 for the period. | Is the sales mix preserving product margin? |
| Refund and cancellation rates | For an order cohort, refunded orders ÷ placed orders and canceled orders ÷ placed orders, each × 100, through a stated observation date. | Are order-quality problems increasing? |
For a campaign or promotion decision, contribution profit can be more useful than gross margin. Subtract the variable costs included in your definition, such as payment fees, fulfillment, shipping subsidies, and marketing. State whether marketing is included so it is not deducted twice.
Segment by device, channel, geography, product, and new versus returning customer when there is enough volume to interpret. A few orders can move a small segment’s rate substantially. Do not compare conversion rates across tools unless their populations, definitions, and tracking match.
3. Separate acquisition efficiency from repeat revenue
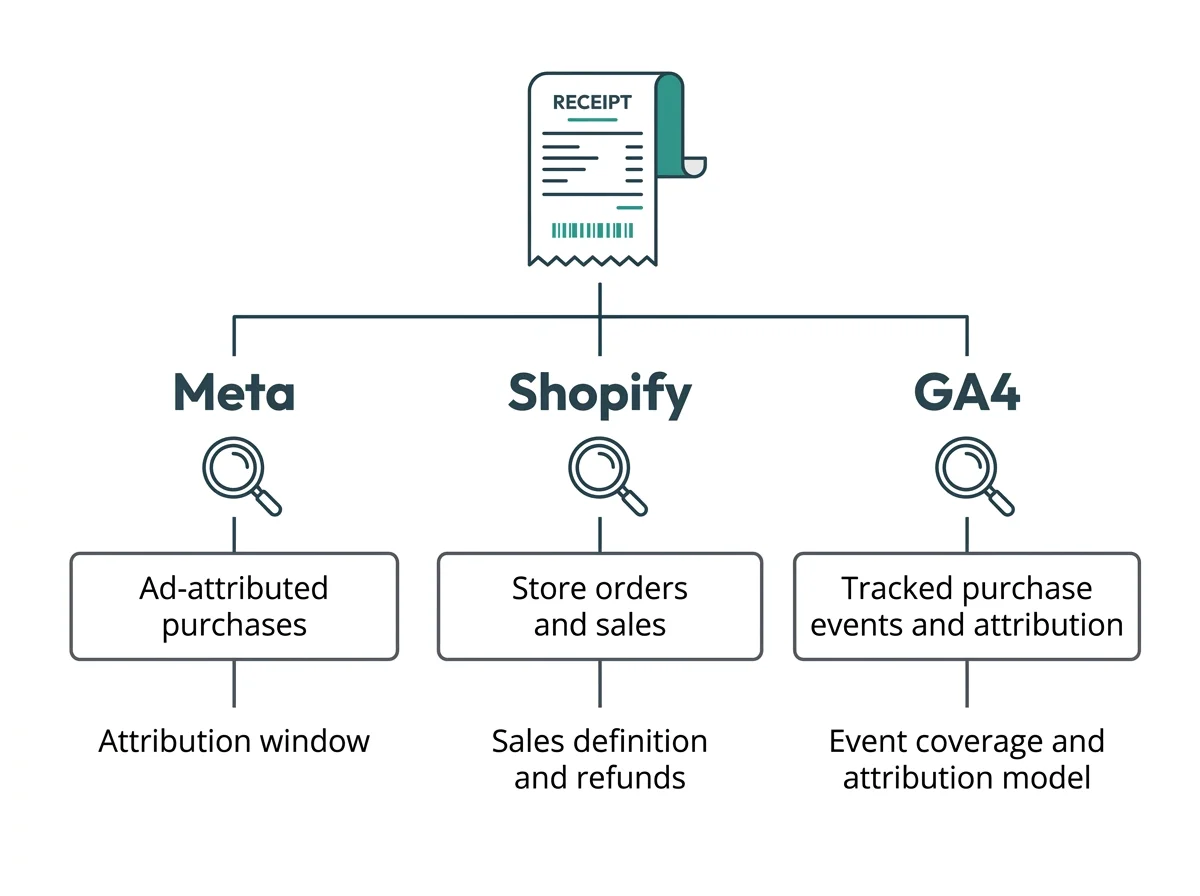
Customer economics, campaign reporting, and blended efficiency answer different questions. Keep these four measures distinct:
- CAC: customer acquisition cost. Included acquisition costs divided by newly acquired customers for the selected period. State whether costs include only media or also creative, agency, and other acquisition expenses. Orders are not the new-customer denominator.
- LTV: customer lifetime value. Estimated value per customer over a defined observation or forecast horizon. Label whether it uses revenue, gross profit, or contribution profit; an observed short-window value is not a complete lifetime outcome.
- ROAS: return on ad spend. Attributed revenue divided by advertising spend for the campaign or channel and reporting period. Keep the attribution model and conversion window visible.
- MER: marketing efficiency ratio. Total selected store revenue divided by total included marketing or advertising spend for the same period. State the revenue basis and which spend categories are included.
Use CAC and LTV to compare customer economics, ROAS to inspect channel reporting, and MER to understand blended efficiency. Separate first-order revenue from repeat-order revenue: stronger repeat sales can improve blended results without making new-customer acquisition more efficient.
An acceptable CAC depends on contribution margin, payback time, and cash available—not a universal target. A platform ROAS decline supports investigation. A budget change should also consider store outcomes, new-customer volume, and blended contribution economics.
4. Compare customer cohorts at the same age
Group customers by first-purchase month, acquisition source, first product, or offer. Then compare what happens after that first order using order-level customer history.
For example, define a 60-day repeat purchase rate as customers in a first-purchase cohort who place another eligible order within 60 days, divided by all customers in that cohort, multiplied by 100. Only compare cohorts whose full 60-day window has elapsed.
Also track time to second order among repeat buyers, eligible orders per cohort customer, and net revenue per cohort customer over that same window. Report these together: second-order timing alone leaves out everyone who has not returned.
Retention rate, repeat purchase rate, and LTV are not interchangeable. Retention requires a definition of an active customer and a period; repeat purchase counts another purchase within a chosen window; LTV measures value over a specified horizon.
Differences by discount exposure, first product, geography, or acquisition source can indicate where to investigate. They do not prove that an acquisition channel or retention message caused the difference. Use the comparison to form a testable hypothesis.
5. Inspect products and the purchase funnel
Read product demand alongside economics and stock
Review product net sales, units, margin, refunds, repeat buying, and inventory availability. For bundles or cross-selling, define attach rate as eligible orders containing both the base item and add-on, divided by eligible orders containing the base item, within the selected period.
- High traffic, weak purchasing: investigate product information, price, shipping expectations, and variant availability.
- Strong demand, limited stock: review replenishment timing before increasing promotion.
- High sales, weak contribution: review discounts and variable costs rather than judging the product by revenue alone.
Find the step that changed
Use a consistently measured path: landing page → product view → add to cart → checkout started → purchase. Define whether each step counts users, sessions, or events, and keep the population and completion window consistent.
For a session-based cart abandonment measure, use: (1 − sessions that added to cart and purchased ÷ sessions that added to cart) × 100 over the selected period. This measures completion within those sessions; it is different from tracking whether a saved cart eventually converts.
If checkout starts stay stable but completed purchases decline, investigate payment errors, shipping charges, and device-specific friction. Break the change down by device, traffic source, landing page, product, and geography.
Event drop-off is directional when event coverage or population definitions are limited. Pair the signal with customer feedback and support tickets. Clicks, time on page, and heatmap activity help form hypotheses; they are not proof of purchase intent.
6. Run one repeatable weekly review
Use the same reporting window and definitions each week. Finish with one to three decisions, not an expanding list of unexplained charts.
- Check data quality. Review date range, order statuses, refunds, spend imports, refresh timestamps, tracking changes, and unusual gaps.
- Review business health. Read net sales, orders, AOV, contribution profit, refunds, and inventory constraints together.
- Review acquisition. Compare spend, new customers, CAC, channel ROAS, and blended MER. Separate repeat revenue.
- Review customer quality. Inspect first-versus-returning customer mix and equal-age cohort movement.
- Review products and funnel steps. Look for stock risk, margin changes, product-to-cart shifts, checkout completion changes, and device differences.
- Explain meaningful changes. Compare with a consistent prior period and account for promotions, seasonality, stockouts, and measurement changes.
- Choose a test, hold, or budget review. Assign an owner, expected effect, timeframe, and measurement method.
- Record and revisit. Save the hypothesis, evidence, action, and result for the next review.
Make the decision explicit
- Test: investigate a mobile checkout issue, then test a targeted fix against the same defined completion metric.
- Hold: keep spend unchanged when one platform’s credited ROAS falls but store results and contribution economics remain stable; record what would trigger reconsideration.
- Budget review: reassess allocation when new-customer CAC rises alongside deteriorating blended efficiency and contribution profit.
- Operations action: prioritize replenishment when product demand, margin, and stock availability point in the same direction.
7. Choose dashboards around recurring questions
Start with a small measurement specification before adding another dashboard. Evaluate whether the tool helps your team answer its recurring questions:
- Definitions: visible formulas, filters, time zones, refund policies, attribution windows, and new-versus-returning logic.
- Coverage: the orders, costs, spend, customer history, products, inventory, and events your decisions require.
- Freshness and reliability: last successful import, refresh cadence, historical backfills, duplicate handling, and missing-data visibility.
- Reconciliation: separate store, platform, and blended views without requiring identical totals.
- Exportability: access to the underlying records and fields needed to inspect calculations and keep a decision log.
- Segmentation and usability: useful cohort, product, channel, device, and date filters without analyst intervention for every question.
- Operating fit: implementation effort, maintenance, consent handling, access controls, and total cost.
A unified view of store revenue and cross-platform ad spend substantially reduces repeated manual reconciliation. It does not promise that every platform will match—each channel uses its own window, identity matching, and conversion definitions—but it provides a consistent operational frame across disparate ad networks.
This is where practical decision support matters. Rather than positioning itself as a universal source of truth, Weberlo connects your store with supported ad sources to reveal how campaigns interact with real store revenue. It detects overlapping revenue credit claimed across advertising platforms, allowing operators to review performance from high-level channel and campaign tiers down to ad set and creative. Through its AI Analytics Agent, operators can inspect connected performance in plain English, ask focused questions about trends, and evaluate scale, reduce, or pause suggestions—with the safeguard that you approve any ad action before it syncs back to ad accounts. It is grounded decision support, not an automated promise of causal proof or guaranteed growth.
8. Interpret attribution without confusing credit and cause
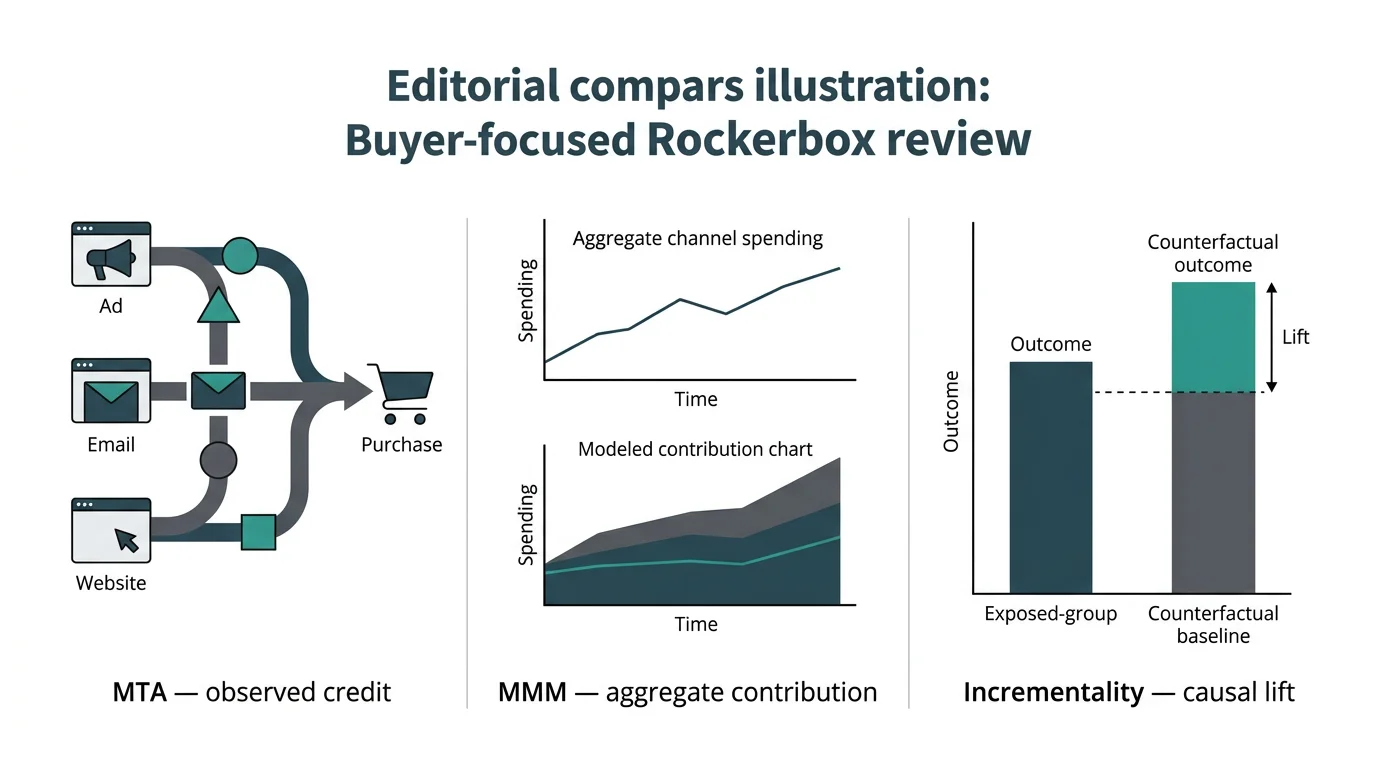
Attribution assigns conversion credit under a model. Causal lift asks what would have happened without the marketing activity. Correlation, credited conversions, and incremental purchases are different concepts.
Systems can differ in event definitions, identity matching, attribution windows, consent rules, time zones, refund treatment, and modeled data. Privacy restrictions, ad blockers, browser changes, and cross-device shopping can leave journeys partially measured. Dashboards need not match because they need not measure the same population or assign credit the same way.
Compare store outcomes, platform reporting, blended efficiency, and customer cohorts; use controlled tests where feasible to evaluate incremental effects. Keep definitions consistent and annotate campaign or tracking changes.
For reconciliation, read Weberlo’s guide to why Meta, Shopify, and GA4 report different revenue. For Shopify-native reports and model detail, use the Shopify attribution guide. The operating routine here is broader: choose the right evidence, make a bounded decision, and record what happens next.
When store revenue, cross-platform spend, and customer cohorts sit in a single decision-oriented framework, you spend less time untangling competing spreadsheets and more time acting on reliable operational patterns. Clearer evidence gives operators the clarity needed to review weekly budgets, protect contribution margins, and allocate the next dollar with confidence. To see how connected analytics streamlines reporting and attribution for growing brands, explore Weberlo's ecommerce analytics solutions.