

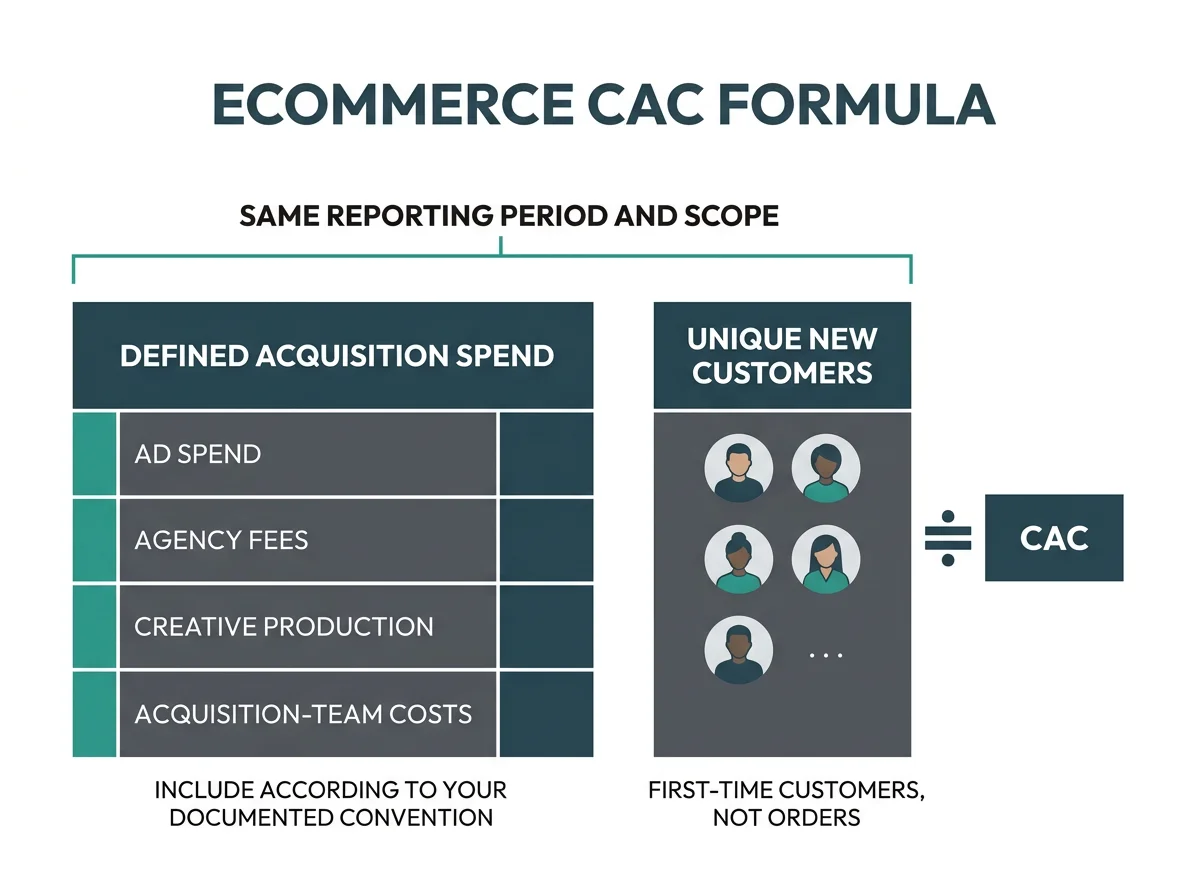
The customer acquisition cost formula is simple. Getting the inputs right is harder. Divide acquisition spend by new customers acquired—but first decide which costs belong in acquisition spend, what makes someone a new customer, and which reporting period you are measuring. Otherwise, a lower CAC can mean a cheaper acquisition engine, more repeat orders, or simply a different calculation.
For a DTC operator deciding whether to increase Meta, Google, or TikTok budgets, those differences matter. Start with a consistently defined business-level CAC. Then use channel reporting to investigate performance, rather than letting each platform define your acquisition economics.
Updated: October 10, 2026
What is the customer acquisition cost formula?
CAC measures the cost of acquiring one new customer. It is not cost per order, click, purchase event, or lead. Those denominators answer different questions—even when a dashboard labels them “acquisitions.”
Calculation conventions used here
The formula is stable; the cost boundary is a calculation convention. This article uses these conventions so the examples can be reproduced:
- New customer: a unique customer whose first valid paid order occurs during the period, with no earlier valid paid order in the store’s customer history.
- Marketing-only CAC: acquisition media spend plus directly allocated acquisition creative, agency or contractor fees, and acquisition software costs.
- Fully loaded CAC: that marketing-only spend plus allocated acquisition staff costs and relevant overhead.
- Period: a calendar month, using the same dates and reporting time zone for spend and first purchases.
These labels are not universal accounting definitions. A media-only metric is useful too, but label it media-only CAC. If your team includes acquisition sales costs, label the result sales-and-marketing CAC and list those costs explicitly. Consistency matters more than choosing the narrowest number.
Calculate ecommerce CAC step by step
Illustrative example: a DTC store measures acquisition for April. All amounts below are hypothetical US dollars, not industry averages or Weberlo customer results.
| Cost category | Amount | Spend scope |
|---|---|---|
| Paid social media | $18,000 | Marketing-only |
| Paid search media | $9,000 | Marketing-only |
| Other acquisition media | $3,000 | Marketing-only |
| Acquisition creative production | $3,000 | Marketing-only |
| Acquisition agency fees | $2,000 | Marketing-only |
| Allocated acquisition software | $1,000 | Marketing-only |
| Marketing-only total | $36,000 | Marketing-only subtotal |
| Allocated acquisition staff costs | $4,000 | Fully loaded addition |
| Relevant allocated overhead | $2,000 | Fully loaded addition |
| Fully loaded total | $42,000 | Fully loaded total |
- Set the period: April 1–30 for both spend and first purchases.
- Build the numerator: $36,000 marketing-only; $42,000 fully loaded.
- Build the denominator: deduplicate customers and identify 600 first-time purchasers during April.
- Divide: marketing-only blended CAC = $36,000 ÷ 600 = $60. Fully loaded blended CAC = $42,000 ÷ 600 = $70.
Both results are valid under the stated conventions. The $10 difference reflects staff and overhead, not a disagreement about how many customers the store acquired.
The wrong-denominator trap
Suppose the same store records 1,000 orders from 800 unique buyers: 600 new customers and 200 returning customers.
- $36,000 ÷ 600 new customers = $60: marketing-only acquisition CAC.
- $36,000 ÷ 800 total buyers = $45: acquisition spend per active buyer, including returning customers.
- $36,000 ÷ 1,000 orders = $36: acquisition spend per order.
Returning customers can improve your business economics without making new-customer acquisition cheaper. Keep those two effects separate.
What costs belong in CAC?
Use marketing-only CAC to monitor acquisition execution. Use fully loaded CAC to understand the broader resources required to sustain that execution. Track both if they support different decisions, but preserve each definition over time.
Shared costs need allocation rules. For example, acquisition campaigns and retention emails may use the same software; an employee may split time between acquisition creative and customer marketing. Allocate the acquisition share using a repeatable basis, such as staff time or documented usage. Do not put the entire bill into CAC one month and exclude it the next.
Creative that runs across several months also needs a consistent treatment. Decide whether your operating report expenses production in the month incurred or allocates it across a defined usage period. Record the rule so a production-heavy month does not silently change the meaning of your trend.
Keep COGS, fulfillment, returns processing, and customer service outside this CAC calculation. They belong in contribution or profitability analysis. Their effect on customer value and payback still matters when deciding what CAC you can afford.
Count new customers, not conversion events
Use customer purchase history to identify first-time buyers. A customer placing three orders during the month contributes one new customer if their first purchase occurs that month—not three acquisitions.
Apply a consistent identity rule across guest checkouts and customer accounts. Document how you handle duplicate records, canceled orders, test orders, and refunded first purchases. For this article’s convention, canceled and test orders do not qualify as valid paid orders; a later refund does not create another acquisition or erase the customer’s first-purchase history. Refunds reduce the cohort’s economic value.
An ad platform’s purchase count is not automatically a new-customer count. If the denominator includes repeat purchases or generic conversion events, the result is CPA for those events—not new-customer CAC. For adjacent definitions, see our advertising metrics guide.
Blended CAC versus channel CAC
Blended CAC divides total acquisition spend within your chosen scope by all unique new customers. It includes new customers across paid, organic, referral, and other acquisition paths. It measures the overall acquisition system, not paid advertising’s isolated effect.
Channel CAC divides a channel’s acquisition spend by new customers credited to that channel. It supports optimization, but its denominator depends on attribution rules.
Channel CAC ratios do not add up to blended CAC. Their underlying customer counts may overlap, omit uncredited customers, or distribute fractional credit. Their cost scopes may also differ—for example, media-only channel reports compared with a fully loaded blended report.
Before comparing channels, align the spend scope, new-customer definition, attribution model, conversion window, and reporting dates. A lower number under a different convention is not evidence of better efficiency.
Why channel CAC can mislead budget decisions
Meta, Shopify, GA4, and other reporting systems can assign different credit to the same purchase. A channel receiving credit does not mean it was the sole cause of that customer’s decision. Multi-touch journeys make independently reported channel numbers especially difficult to interpret.
Use channel CAC directionally alongside blended CAC, actual new-customer growth, first-party customer surveys, incrementality tests, and cohort contribution outcomes. For the mechanics, see attribution models; for reporting differences, see why Meta, Shopify, and GA4 report different revenue.
Weberlo combines connected store revenue and cross-platform ad spend, detects overlapping platform credit, and shows visible customer journeys. Those capabilities help you inspect the evidence behind channel reports while keeping your CAC calculation conventions explicit.
Choose a time window that supports the decision
- Weekly: monitor pacing and investigate sudden changes.
- Monthly: review acquisition efficiency and budgets when customer volume is sufficient.
- Quarterly: assess broader trends when purchase cycles are longer or monthly volume is low.
Matching calendar dates is necessary, but it does not eliminate conversion lag. Spend late in April can produce first purchases in May. After a major budget increase, April CAC can rise before those customers arrive.
Keep the calendar-period calculation intact, then examine longer periods and delayed conversion patterns separately. Do not move customers between months selectively to improve the reported result. Annotate promotions, launches, seasonality, and major spend changes, and compare like-for-like periods.
CAC, ROAS, MER, LTV, and payback answer different questions
- CAC: what did acquiring a new customer cost?
- ROAS: how much attributed revenue did advertising generate relative to ad spend?
- MER: how much total revenue did the business generate relative to total marketing spend?
- LTV: what is an acquired customer worth over time?
- Payback: how long does cumulative customer contribution profit take to recover CAC?
Strong ROAS or MER can include substantial repeat-customer revenue while new-customer CAC deteriorates. Our MER guide and MER versus ROAS comparison explain those boundaries.
For LTV:CAC, state whether LTV is revenue-based or contribution-based. A revenue multiple alone does not establish acquisition profitability. Use the customer lifetime value formula and LTV calculation guide for customer-value detail; keep this budget decision anchored to contribution and cash recovery.
Use CAC to decide whether to scale, investigate, or reduce
Set a target CAC from expected contribution profit, customer value, cash constraints, and acceptable payback time. There is no universal ecommerce CAC number that can replace those limits.
- Scale: blended CAC and payback remain within your economic limits, and acquired cohorts support the expected contribution.
- Investigate: channel CAC rises while total new-customer growth, contribution outcomes, or cohort quality improves. Examine attribution credit and conversion lag before cutting.
- Reduce or pause: CAC rises alongside weak conversion, poor customer quality, or payback beyond what your cash position can support.
Watch marginal CAC when increasing spend
Average CAC can hide diminishing returns. In a hypothetical expansion of the April example, marketing-only spend rises from $36,000 to $48,000 and new customers rise from 600 to 700. Average marketing-only CAC becomes $68.57, but the observed additional spend per additional new customer is $12,000 ÷ 100 = $120.
That marginal view exposes the cost of the next growth step. It does not, by itself, prove the added spend caused all 100 additional customers. Compare similar conditions and use controlled incrementality tests when the causal effect is central to the decision.