

Your agency presents one ROAS number, Meta shows another, and Shopify revenue does not line up with either. Before moving budget, you need to know whether you are looking at a tracking problem, a definition problem, or different systems assigning credit to the same sale.
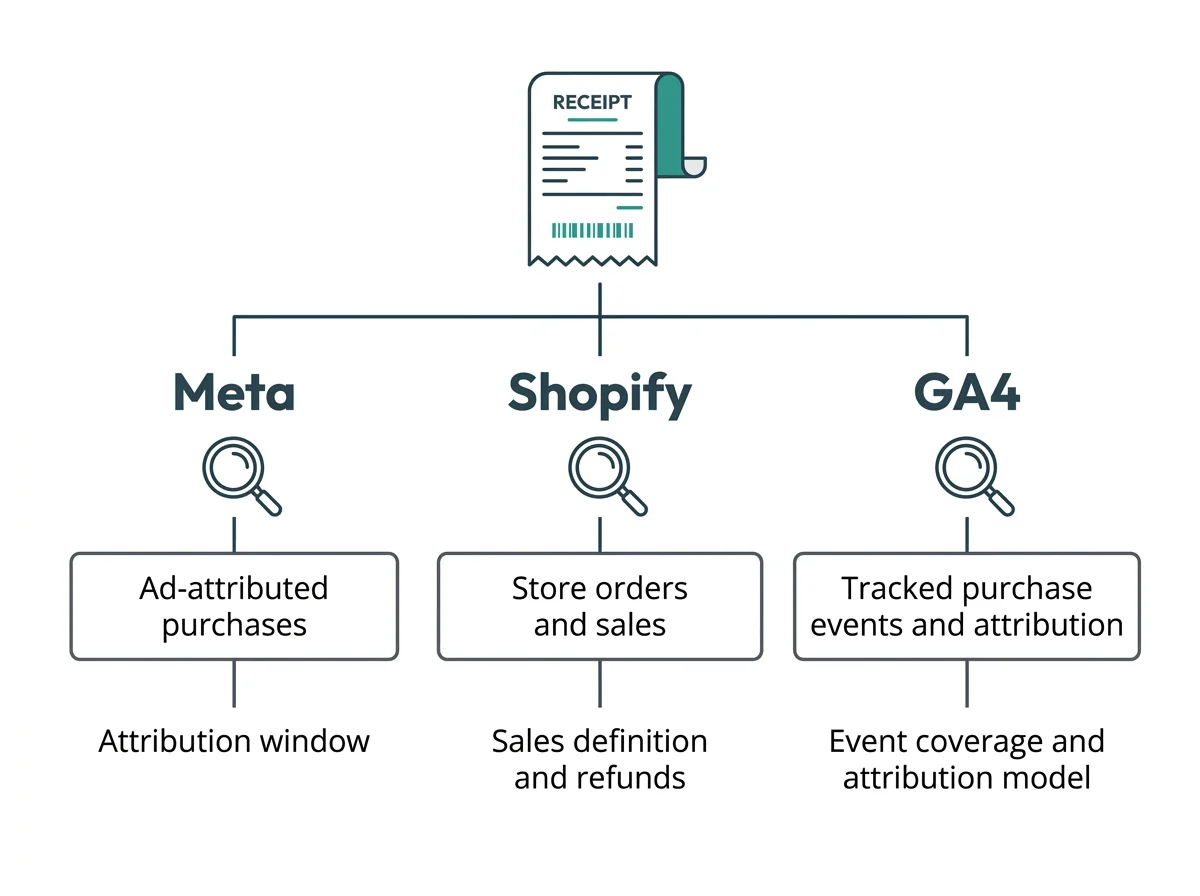
You can explain the gap, diagnose it systematically, and choose the right number for your next budget decision—without making every dashboard match. Meta, Shopify, and GA4 measure different layers: ad-attributed outcomes, store orders, and measured ecommerce journeys.
What each platform is actually measuring
An actual store order, an analytics purchase event, and a platform-attributed conversion are related—but they are not interchangeable.
| System | What the number represents | Best use |
|---|---|---|
| Shopify | Orders and sales under the selected financial report definition. | Store-level commercial baseline, sales, and returns. |
| Meta Ads Manager | Events and revenue credited to Meta ads under selected attribution settings. | Meta campaign, ad-set, and creative optimization. |
| GA4 | Implemented ecommerce events and channel credit across measured journeys. | Acquisition analysis, funnel behavior, and journey context. |
| Blended reporting | Revenue and spend standardized under a management policy. | Consistent budget reviews and cross-channel comparisons. |
Shopify is the operational reference for whether an order exists. GA4 needs ecommerce tracking to receive a purchase event. Meta needs conversion signals and an eligible ad interaction to assign credit. An order can exist even when an analytics event is missing.
Marketing attribution assigns credit; it does not create another set of orders. A shopper might see a Meta ad, later click a search ad, and buy. Meta can credit the purchase within its view-through window while GA4 assigns measured credit to paid search. Two claims still describe one purchase.
A revenue discrepancy is a question to investigate, not automatic evidence that a platform is broken.
The eight reasons revenue and ROAS disagree
1. Attribution windows cover different periods
A window defines how long an earlier interaction can receive conversion credit. Meta supports click-through windows such as one day or seven days and view-through credit such as one day after an impression.
If a shopper clicks on Monday and buys on Thursday, a seven-day click window can include the sale; a one-day click window will not credit that Monday click. GA4 has its own key-event lookback settings. Meta results also depend on the ad-set attribution setting, so campaign totals can combine different windows.
2. Click-through and view-through credit are different
Click-through credit follows an ad click. View-through credit follows an impression without requiring a click. Meta can include both, depending on the selected settings.
A ROAS number that includes view-through conversions is not directly comparable with a click-only number. Separate the available attribution views to understand how much of a performance difference comes from crediting rules rather than additional orders.
3. Attribution models distribute credit differently
GA4's reporting attribution model, eligible channels, and lookback window affect which touchpoints receive credit. Data-driven attribution and rules-based attribution can distribute the same purchase differently.
Meta applies its own attribution approach. Even with aligned dates and values, neither system is required to assign the same revenue to Meta. Compare consistent policies within a system before comparing results across systems.
4. Modeled conversions add estimated outcomes
Meta and GA4 can use statistical modeling when outcomes cannot be measured directly. Privacy restrictions, technical limitations, and cross-device behavior can leave gaps that modeling estimates.
GA4 consent mode can support modeled key events when eligibility requirements are met. A modeled aggregate is not a list of individually observed orders. Keep modeled attribution separate from order-level event matching rather than treating every estimated conversion as a missing transaction.
5. Reporting dates and time zones shift totals
An order placed at 11:30 p.m. in one time zone can fall on the next calendar day in another. Ad accounts, GA4 properties, Shopify reporting tools, and exports can use different day boundaries.
Shopify sales-report data uses a UTC-based boundary, while reporting tools can support selected time zones. Record the time zone and date basis for the exact report you are comparing. A seven-day label alone does not establish identical coverage.
6. Revenue definitions change the numerator
Shopify net sales equal gross sales minus discounts and sales reversals. Total sales include additional components such as taxes, duties, shipping charges, and fees under the report definition. Shopify records a positive sale when an order is placed and a negative amount when a return is recorded.
If your analytics purchase value contains discounted merchandise revenue while the Shopify comparison includes shipping and tax, the values will differ. Returns, cancellations, subscription renewals, and refund timing can widen the gap. Specify the metric—not just “revenue.”
7. Purchase events can be missing or duplicated
GA4 purchase events can be missing because a tag fails, a checkout path is uncovered, or a payment redirect interrupts delivery. They can be duplicated if multiple implementations fire or a confirmation-page refresh sends the purchase again.
Send a unique transaction_id for each GA4 purchase so repeated events for the same transaction can be deduplicated. For Meta, browser Pixel and Conversions API copies of the same event need appropriate shared deduplication keys. Event deduplication is separate from deduplicating revenue credit claimed by multiple advertising platforms.
8. Consent and privacy controls reduce signal coverage
Consent choices, browser restrictions, blockers, and missing identifiers affect event collection and matching. A received event can still lack the signals needed to connect it to an ad interaction.
Lower measured revenue does not necessarily mean lower actual sales. Higher attributed revenue does not prove incremental sales. Server-side, first-party tracking can support signal resilience, but budget decisions still require consistent definitions and commercial context.
First decide which revenue question you are asking
- “How many orders did the store generate?” Start with Shopify orders and the relevant sales report.
- “How did Meta report its ads?” Use Meta Ads Manager with a consistent attribution setting.
- “Which channel received measured credit?” Use GA4 and identify the report's attribution model and scope.
- “Did more advertising create more sales?” Use a controlled incrementality test.
When leadership asks for “one true ROAS,” replace the vague label with an explicit decision metric: Meta-reported ROAS, measured channel ROAS, or blended store-revenue-to-ad-spend ratio.
A step-by-step revenue reconciliation workflow
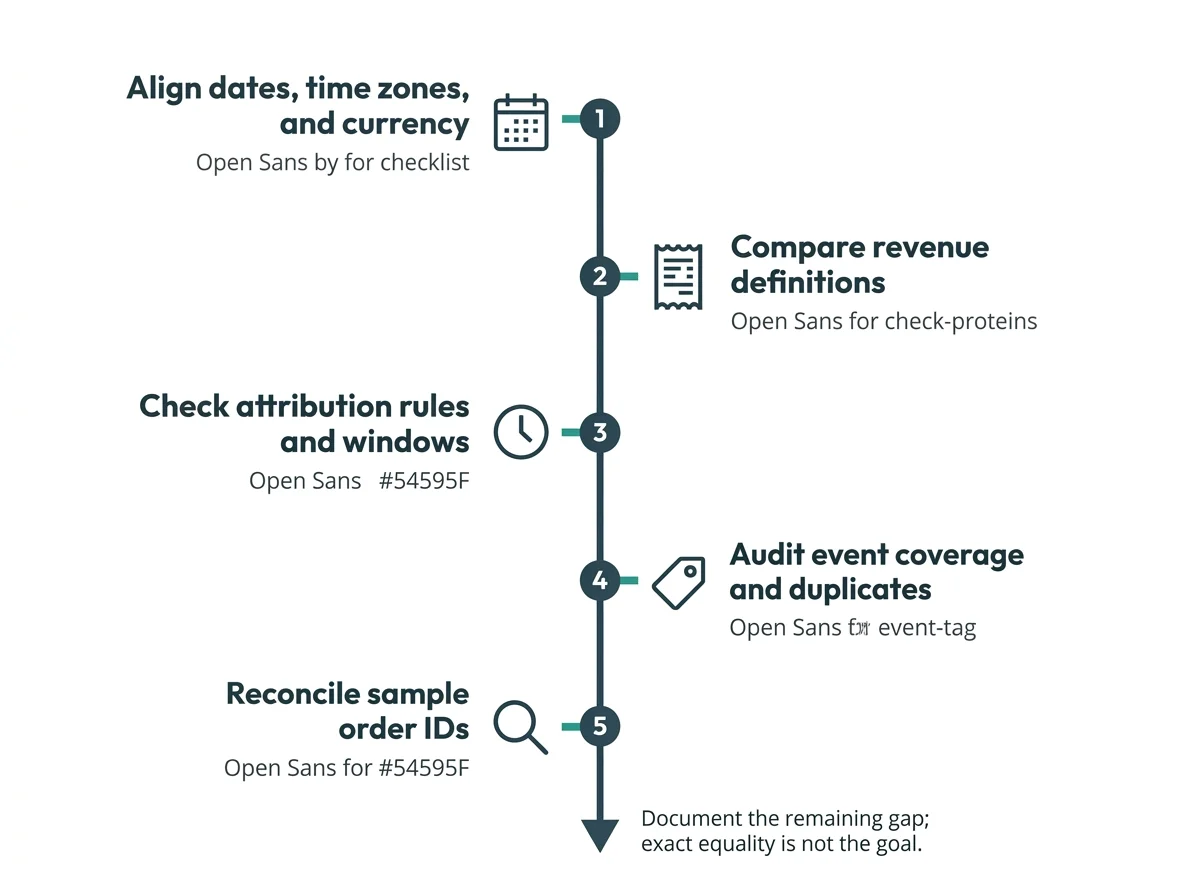
Start with order existence and value, then move outward to event delivery and attribution. This avoids spending hours explaining attribution when the purchase tag is simply sending the wrong amount.
1. Freeze the comparison period
Use the same start and end dates. Record each reporting time zone and normalize timestamps for order-level comparisons. Save the reports and settings used so the team can repeat the comparison without changing the baseline.
2. Declare the revenue and spend definitions
Choose gross sales, net sales, total sales, or another clearly defined business measure. Write down treatment of discounts, taxes, shipping, refunds, cancellations, and returns. For ROAS, also define which advertising costs enter the denominator.
3. Record attribution settings
Capture Meta's click-through window, view-through setting, and conversion count. Record GA4's reporting attribution model, eligible channels, and key-event lookback window. Keep event totals separate from attributed channel totals.
4. Match orders to purchase events
Start with Shopify order IDs and map them to GA4 transaction IDs where available. Look for missing IDs, duplicate IDs, zero-value purchases, and incorrect values. Test confirmation-page refreshes and overlapping tagging implementations.
Inspect Meta's browser/server event identity and deduplication diagnostics independently. Matching purchase-event counts is useful, but counts alone can hide one missing purchase and one duplicated purchase that cancel each other out.
5. Inspect coverage and build the bridge
Exercise different browsers, devices, payment methods, and checkout paths. Review consent behavior, server delivery, Meta Events Manager diagnostics, and GA4 DebugView or event reports. Then record each discrepancy in an order-level bridge.
Useful bridge fields include order ID, order timestamp, chosen Shopify revenue value, GA4 transaction ID and value, observed source/medium, campaign, attribution settings, and discrepancy category. Include platform credit where order-level information is available; keep aggregate-only and modeled credit in a separate summary.
Classify each difference as timing, value definition, missing event, duplicate event, attribution policy, or modeled/aggregate credit. The goal is an explained reconciliation bridge—not an unexplained adjustment that forces the totals to agree.