

Your ad platform reports strong ROAS. Your store’s revenue barely moves. Should you increase spend, cut the channel, or keep it running? Attribution alone cannot settle that question. Incrementality testing estimates the additional business outcomes caused by marketing, beyond what would have happened anyway.
For ecommerce and DTC teams, the practical challenge is choosing an incrementality test your order volume, customer data, and channel controls can support. Start with the budget decision, choose the strongest feasible comparison, and decide what evidence would justify changing spend before the test begins.
What incrementality testing actually answers
An incrementality test asks: what would sales, orders, or new-customer acquisition have looked like without this marketing activity? That unobserved alternative is the counterfactual. A control group or comparison market helps estimate it.
The treatment receives the marketing activity being tested. The control does not receive that activity, or receives a different spend level. The difference in outcomes, after accounting for group size and the test design, estimates incremental impact.
Simply comparing exposed customers with unexposed customers is not enough. Customers who see or click ads may already be more likely to buy. Random assignment helps separate the effect of marketing from those pre-existing differences.
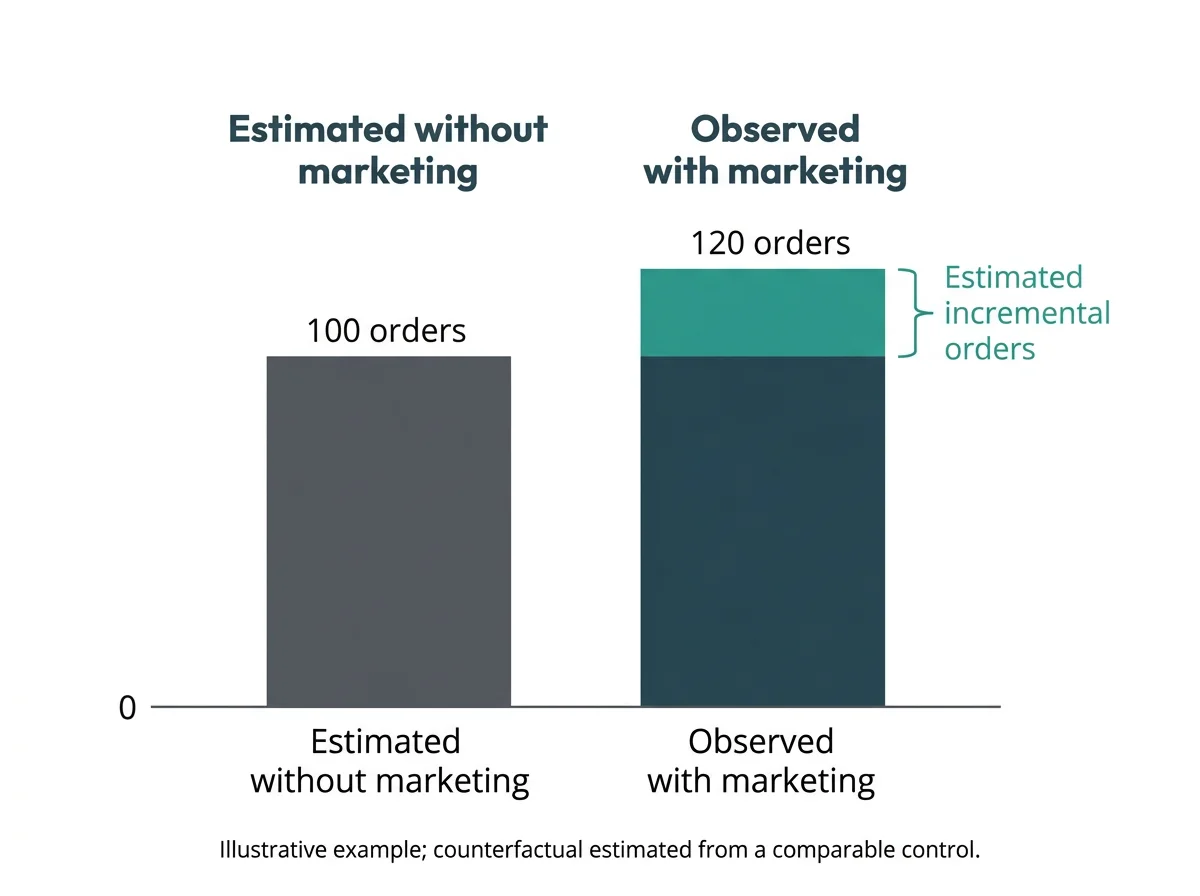
- Incremental orders: observed orders minus estimated counterfactual orders.
- Incremental lift: incremental outcomes divided by counterfactual outcomes, expressed as a percentage.
- Incremental revenue: observed revenue minus estimated counterfactual revenue.
- Incremental ROAS, or iROAS: incremental revenue divided by the marketing spend associated with the tested intervention.
Use comparable populations and measurement windows. Raw totals from differently sized treatment and control groups do not produce a valid lift calculation.
Incrementality versus attribution versus MMM
These methods provide different kinds of evidence. None should be treated as an interchangeable answer to every spending question.
| Method | What it answers | Best decision context |
|---|---|---|
| Attribution | Which tracked touchpoints received conversion credit? | Routine campaign reporting and customer-journey analysis. |
| Incrementality testing | What changed because of a specific marketing intervention? | A focused scale, maintain, reduce, or pause decision. |
| Marketing mix modeling | How does aggregated historical performance relate to marketing and other business drivers? | Broader portfolio planning and budget scenarios. |
Platform attribution credit is not incremental lift. An ad can receive credit for an order that would have occurred through another route. Likewise, modeled contribution is an estimate from a model, not the same evidence as a controlled experiment.
Use marketing attribution and cross-channel attribution for reporting context. For the broader planning role of models, see our guide to marketing mix modeling for ecommerce. Here, the goal is narrower: choose the next useful experiment.
Start with the budget decision, not the method
“Is this channel incremental?” is too broad. A more useful question is: “Does our current retargeting spend generate enough additional contribution profit to justify keeping it?” The answer applies to that intervention, audience, and spend level—not every possible use of the channel.
Write down five things before choosing a design:
- Decision: scale, maintain, reduce, pause, or retest a defined activity.
- Hypothesis: the activity adds enough new customers, revenue, or profit to meet your business threshold.
- Primary outcome: one KPI that directly supports the decision.
- Economic threshold: the minimum acceptable iROAS, maximum incremental acquisition cost, or required contribution profit.
- Action rule: what you will do when the evidence clears, fails, or remains uncertain around that threshold.
A useful test plan finishes this sentence: “If the result shows _____, we will change _____.”
Distinguish a test of existing spend from a test of additional spend. Holding out current advertising asks whether that activity adds value. Testing an increase asks whether the extra budget adds value. A profitable current channel does not automatically justify the next dollar.
Choose the strongest feasible incrementality test
1. Randomized audience holdout
Choose this when: you have an identifiable eligible audience, sufficient conversion volume, and reliable exclusion controls. Retention and win-back campaigns are natural candidates; some prospecting questions also fit when assignment and suppression are workable.
Randomly assign eligible people to treatment and control before launch. Keep the control excluded from the tested activity throughout the window. Compare outcomes using the assigned groups, rather than selecting only people who ultimately saw or clicked an ad.
Main failure mode: identity gaps and audience overlap. A control customer may receive the activity through another account, device, or overlapping campaign. Other channels can also change behavior during the experiment.
2. Geo holdout or matched-market test
Choose this when: customer-level control is impractical, but media delivery and business outcomes can be separated by geography. This can fit CTV, audio, offline media, and omnichannel questions.
Select markets with comparable historical trends, order density, and relevant business conditions. Change exposure or spend in treatment markets while retaining the planned baseline in controls. The analysis must account for differences between markets; comparing two cities’ raw revenue totals is not enough.
Main failure mode: geographic leakage or a poor match. Travel, overlapping media delivery, regional promotions, weather, local events, and different retail distribution can weaken the comparison.
3. Platform conversion-lift study
Choose this when: the question concerns one platform and its study framework can manage treatment and control assignment for the campaign.
This can be a practical starting point for a channel-specific budget question. Define the intervention and outcome, then interpret the result within the platform’s eligible population and measurement scope.
Main failure mode: treating a platform-specific answer as a complete marketing-mix answer. A study confined to platform-measured conversions does not capture every store, marketplace, or retail outcome.
4. Time-based pause or spend-change test
Choose this when: neither audience nor geographic isolation is feasible. Pause or change spend for a planned window and compare performance with a baseline or modeled expectation.
This is simpler operationally but weaker causally. The “before” period is not a simultaneous control. Seasonal demand, promotions, competitor activity, and other channel changes can move sales at the same time.
Main failure mode: attributing every business change to the pause. Use the result as directional evidence, not as equivalent to a clean randomized holdout.
When a synthetic control helps
A synthetic control combines historical patterns from comparison markets to estimate what a treatment market would have done without the intervention. It can help when no single market is a good match, but requires stronger analytical expertise and explicit modeling assumptions. It is not equivalent to random assignment.
Run a DTC readiness check before committing spend
The best theoretical design may be impractical for your brand. Check whether the proposed test can detect an effect large enough to matter.
- Conversion density: count expected orders within each eligible group or market—not just storewide monthly orders. Sparse outcomes make small effects hard to distinguish from noise.
- Purchase-cycle length: allow time for customers to move from exposure to purchase. A short window can miss delayed responses.
- Geographic distribution: a business concentrated in one market may lack credible geo controls, even with substantial total revenue.
- Identity and suppression: audience tests need enough identity coverage to maintain meaningful separation between groups.
- Contamination risk: identify overlapping campaigns, shared households, cross-market media, and other routes into the tested activity.
- Business-outcome coverage: include relevant store, marketplace, and retail sales so a shift in purchase location does not look like lost demand.
Low volume is a reason to change the plan, not lower the standard of evidence. Consider a larger eligible audience, a longer feasible window, or a more material intervention. If none can support the economic question, defer the test. A weak experiment can produce an inconclusive result while still costing time and revenue.
Design the test around duration, power, and stable conditions
Choose the primary KPI across the business
For acquisition, new customers may be more useful than total orders. For a revenue question, measure net revenue consistently. For a profitability decision, connect incremental revenue to contribution margin and the cost of the intervention.
Track secondary outcomes such as orders, average order value, repeat purchases, and total revenue to explain the result. Do not switch the primary KPI after seeing which metric looks most favorable.
Define the minimum detectable effect
The minimum detectable effect is the smallest lift the design is planned to detect at the chosen statistical settings. Power describes the chance of detecting that effect if it exists.
Plan using baseline conversion rates or outcome variability, group sizes, assignment structure, and the smallest economically meaningful effect. Geo tests also depend on the number and comparability of markets; thousands of orders in only a few regions do not behave like thousands of independently randomized people.
If the test can only detect a very large lift, it may not answer whether a smaller but profitable lift exists. There is no universal minimum order count that works for every incrementality test.
Set the full measurement window
Duration should cover the purchase cycle and generate enough outcomes for the planned analysis. Include delayed conversions and carryover effects in the window definition. A pause may not immediately remove the influence of earlier advertising.
Set the end date before launch. Do not stop because an early result looks favorable or unfavorable. Repeatedly checking results and ending at a convenient moment can distort the conclusion.
Keep unrelated business changes stable
Where possible, hold pricing, promotions, inventory, checkout, landing pages, and overlapping channel activity steady. Keep creative stable unless creative is the tested variable. Record unavoidable changes and exposure leakage so they can be considered in interpretation.
Hypothetical example: credit, lift, and profitability
The following numbers are hypothetical, not brand results or benchmarks. Suppose a randomized audience test compares equally sized treatment and control groups over the same period. Treatment generates 1,200 orders; control generates 1,000. Net revenue averages $80 per order in both groups.
- Estimated incremental orders: 1,200 − 1,000 = 200.
- Estimated order lift: 200 ÷ 1,000 = 20%.
- Estimated incremental revenue: 200 × $80 = $16,000.
- Tested marketing spend: $10,000.
- Estimated iROAS: $16,000 ÷ $10,000 = 1.6.
If the platform credited $40,000 of revenue to that activity, its attributed ROAS would be 4.0. That credit answers a different question from the experiment’s estimated $16,000 of additional revenue.
Now assume a 50% contribution margin before the tested marketing expense. The incremental revenue yields $8,000 of contribution before advertising. Subtracting $10,000 of spend leaves −$2,000 in incremental contribution after advertising. Positive lift alone would not justify scaling under that immediate-profit rule.
These calculations are point estimates. A spending decision also needs the uncertainty around the result. The order totals alone do not establish statistical significance.
Turn the result into scale, hold, reduce, or retest
Read the estimated effect and its uncertainty against your pre-agreed economic threshold—not just against zero.
| Evidence | Budget action |
|---|---|
| Credible positive lift with economics above the required threshold. | Scale in a controlled step, then monitor whether added spend still performs. |
| The uncertainty range includes both acceptable and unacceptable economics. | Hold while planning a more informative test. |
| A sufficiently precise result falls below the economic threshold. | Reduce or reallocate the tested activity. |
| Low power, contamination, poor matching, or insufficient duration prevents a clear answer. | Retest with a stronger design. |
A flat or non-significant result is not automatically proof of zero value. A wide uncertainty range may still include meaningful positive lift. Conversely, a precise estimate near zero can support reducing activity when it rules out the effect needed to make the economics work.
A negative estimate deserves the same discipline. Separate credible negative impact from noisy results or broken controls. Statistical significance and business significance are different: a reliably positive lift can still be too small to cover its cost.
For acquisition decisions, incremental CAC equals the tested acquisition spend divided by incremental new customers. Total incremental orders cannot substitute for incremental new customers. When the estimated customer increase is near zero or negative, the ratio is not a useful positive acquisition-cost target.
Treat every result as specific to its audience, spend level, creative, timing, and surrounding channel mix. Use it to calibrate decisions, not create a permanent universal channel benchmark.
Common mistakes that weaken the answer
- Contaminated controls: control customers or markets still receive the tested activity, shrinking the exposure difference.
- Too-short tests: the window ends before enough purchases or delayed responses occur.
- Too few conversions: noise overwhelms the effect the budget decision depends on.
- Multiple simultaneous changes: media, pricing, promotions, and checkout change together, making the driver unclear.
- Platform-only outcomes: the analysis misses purchases elsewhere in the business.
- Attribution treated as causal proof: credited revenue is used as evidence of additional revenue.
The remedy is not a more impressive-looking report. It is a focused question, meaningful treatment/control separation, sufficient data, and an action rule that respects uncertainty.